There are many different ways to move data from NI LabVIEW software into Microsoft Excel. Each method has advantages and drawbacks, so we’ll explore some of the available options to help you find the right one for your application.
Comparison Table
|
Export |
TDMS File |
CSV File |
Report Gen. |
DIY ActiveX |
NI DIAdem |
| Interactive |
√ |
|
|
|
|
√ |
| Programmatic |
√1 |
√ |
√ |
√ |
√ |
√ |
| Custom formatting |
|
|
|
√ |
√ |
√ |
| Works without Excel being installed |
|
√ |
√ |
|
|
√ |
| Automatically saves metadata |
|
√ |
|
|
|
√ |
| Requires additional software |
|
√2 |
|
√3 |
|
√4 |
| File based transfer |
|
√ |
√ |
|
|
√ |
| Automation interface transfer |
√ |
|
|
√ |
√ |
√ |
1 data can be sent to Excel programmatically but requires manual action to save the file
2 requires the TDM Excel Add-In for Microsoft Excel – free to download and installs with recent versions of LabVIEW
3 requires the NI LabVIEW Report Generation Toolkit for Microsoft Office
4 requires DIAdem
Export to Excel Right-Click Menu
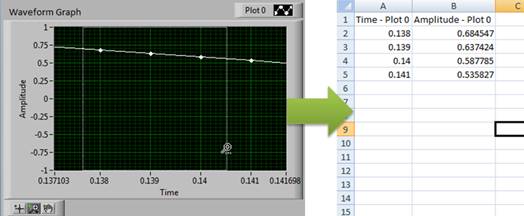
The easiest way to get visible data from LabVIEW into Excel is by right-clicking on the front panel indicator that is displaying the data you wish to export and selecting Export»Export Data To Excel.

[+] 크게 보기
You can use the Export Data To Excel method with any graph, chart, table, array, or digital data control. Graphs and charts export only the visible data, meaning you can use the graph tools to zoom in on a region of interest and export only the data you care about. Tables export only the currently selected data, whereas arrays export all of the data in the array.
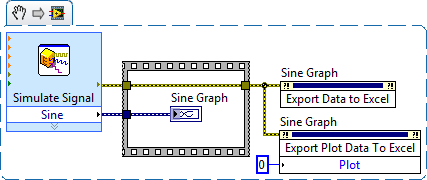
You can also use an Invoke Node to programmatically call the Export Data to Excel and Export Plot Data To Excel methods. The following code snippet graphs a generated sine wave and then exports the plot data to Excel twice in order to show the two different methods. The difference between the two methods is that the Export Plot Data To Excel method exports only the specified plot, whereas the Export Data to Excel method exports data from all plots. This simple example has only one plot, so both methods yield identical results.
If you use this technique, note that Excel must be installed on the same machine as LabVIEW and there is no programmatic access to save the Excel file. Consequently, this approach is best suited to applications where you are interactively investigating data and looking for a quick way to send the data to Excel for analysis or distribution.
Note: The Export To Excel feature was introduced in LabVIEW 2010 and is not available in earlier versions.
Save to TDMS File
NI defined the Technical Data Management Streaming (TDMS) file format in response to the need for a fast, efficient way of saving well-documented measurement data. Although TDMS is not natively supported by Excel, there is a free Excel add-in that you can use to import your data into Excel.
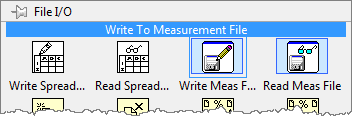
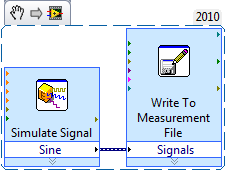
The easiest way to create a TDMS file is to use the Write To Measurement File Express VI located in the File I/O palette.
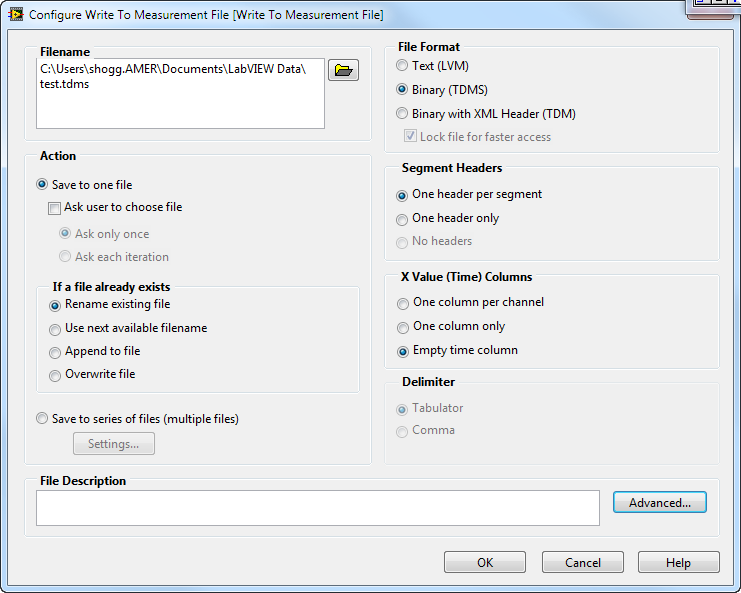
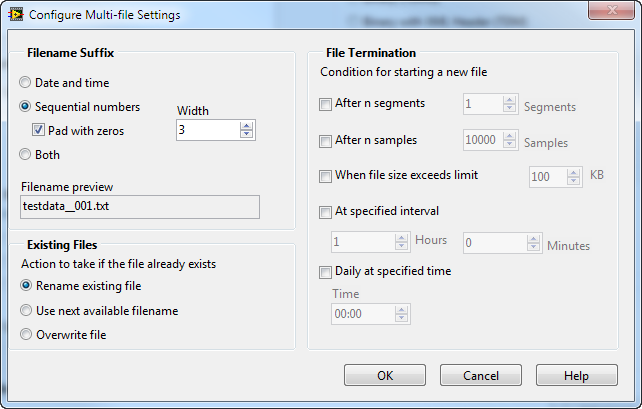
As with all Express VIs, you will see a configuration dialog when you drop the VI on your block diagram. This particular Express VI can save to more than just TDMS, so be sure to select Binary (TDMS) in the File Format section. You have several options for how to save the file and what to do when the selected file already exists.
[+] 크게 보기
You can save to a series of files using a time- or file-size-based schedule by clicking on the Settings… button.
[+] 크게 보기
This results in a very simple block diagram:
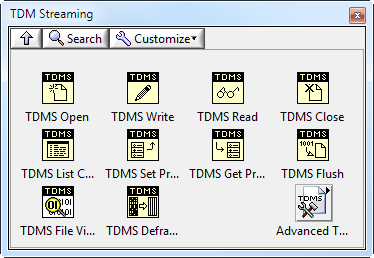
LabVIEW also provides an API for writing to TDMS files without using the Express VI for those who prefer more manual control.
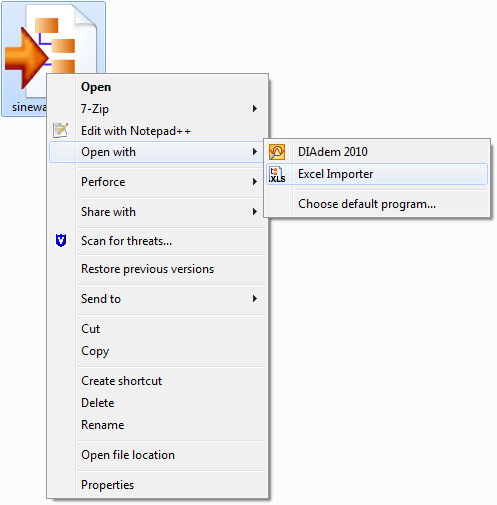
Once you have some data stored in a TDMS file, you need to make sure you have the TDM Excel Add-In for Microsoft Excel. You may have installed the add-in when you installed LabVIEW, if not, you can always download it for free. With the add-in installed, you can simply right-click on a TDMS file and select Open With»Excel Importer, then Excel opens and displays your data.
The first worksheet in Excel always contains the file properties and other metadata.
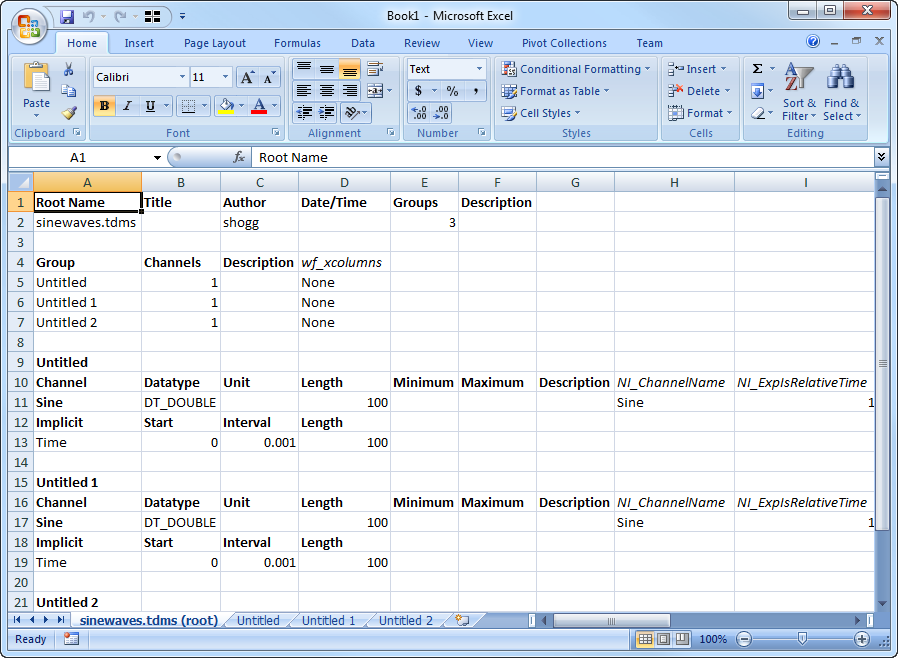
[+] 크게 보기
Each group of channels is loaded as a separate worksheet and each channel of data is shown in its own column.
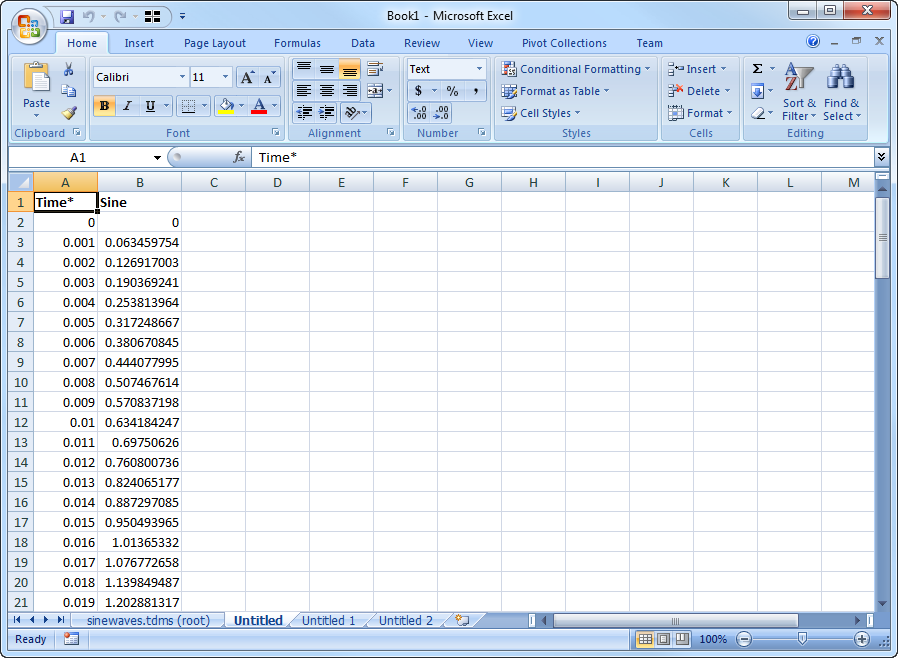
[+] 크게 보기
Once the data is in Excel, there is no dependency or link back to the original TDMS file (although the original file can be recreated using the ExcelTDM DataPlugin in either LabVIEW or DIAdem), so you are free to share your workbook with any Excel user.
Save to CSV File
The comma-separated values (CSV) file format is widely supported, so you can open the file in Excel, but also import it into other spreadsheet, database, or analysis tools. CSV files are human-readable text files with columns separated by commas and rows separated by newlines. This normally requires us to do a little data manipulation in LabVIEW to get the measurement data into an appropriate format because we cannot use complex data types such as waveforms, nor can we store numbers in the more efficient binary formats used internally by LabVIEW and TDMS files.
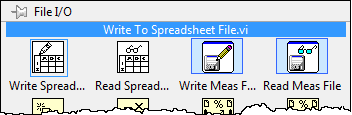
You can use the Write To Spreadsheet File VI, found in the File I/O palette, to create CSV files to open in Excel.
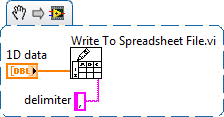
For a simple 1D array of numbers, you don’t actually need to do any additional processing. By default, the Write To Spreadsheet File VI uses a tab (/t) as its delimiter so you just need to specify a comma (,) as its delimiter instead.
A more complex example involves writing the data returned by an Express VI, such as the DAQ Assistant or Simulate Signal, to a CSV file with time in one column and the measured value in the next. The code snippet below shows how you might convert the dynamic data into an array of waveforms; then and then for each waveform in the array convert all of the measured values to strings; then formulate a time string for each sample; and finally build a 2D array of these strings to pass to the Write To Spreadsheet File VI.
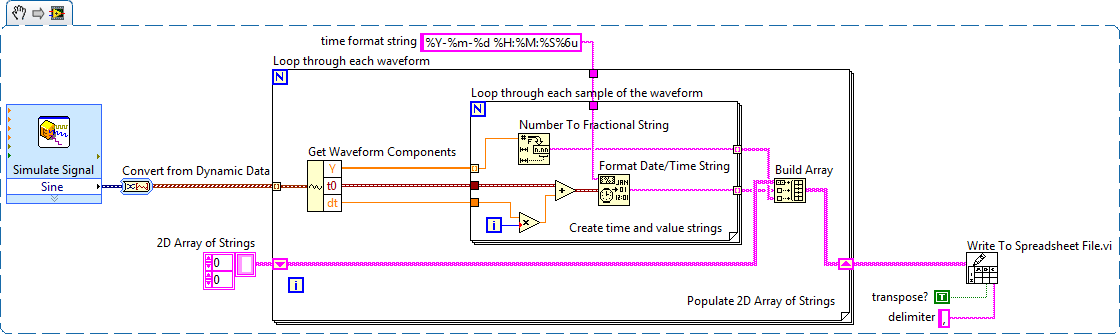
[+] 크게 보기
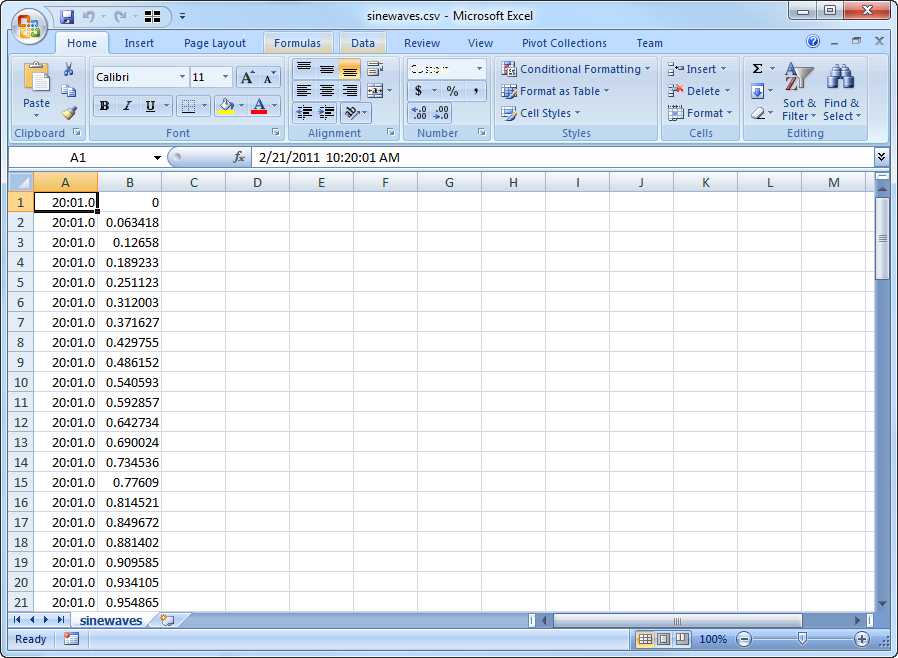
You can open the CSV file with Excel and you will see your data correctly split out into columns and rows.
[+] 크게 보기
If you use the code snippet above, Excel will understand your timestamp, but probably won’t format it in a useful way – it’s unusual to deal with seconds and fractions of seconds in the business world that Excel was created for. To fix this, you have to format the cells containing time data with a custom format as shown below.
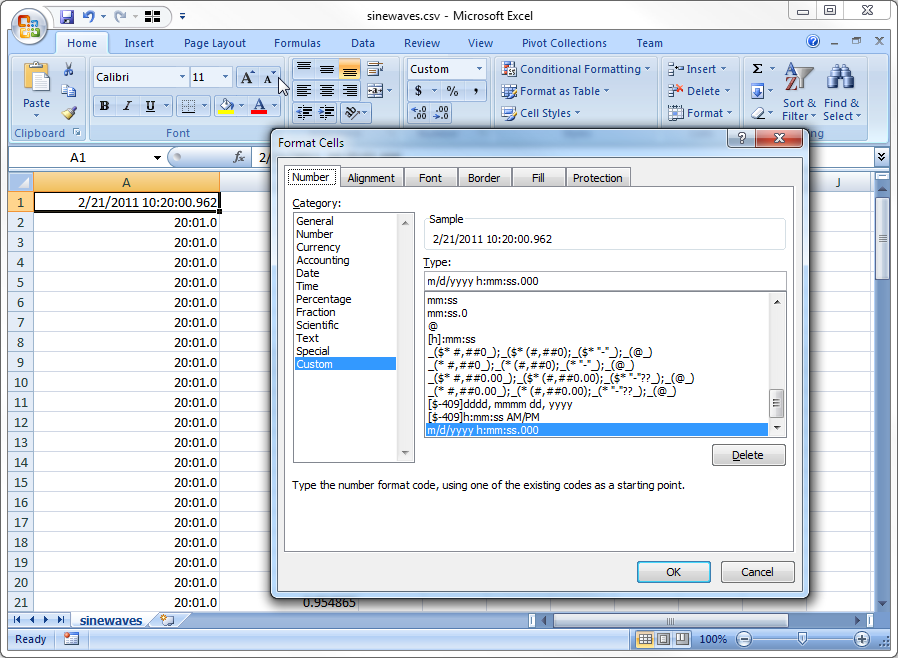
[+] 크게 보기
One of the drawbacks is that you cannot save this formatting information in the CSV file so it must be manually repeated every time you bring a new file into Excel. Although once in Excel, you can save the data as an Excel file to preserve the formatting for subsequent use.
Report Generation Toolkit for Microsoft Office
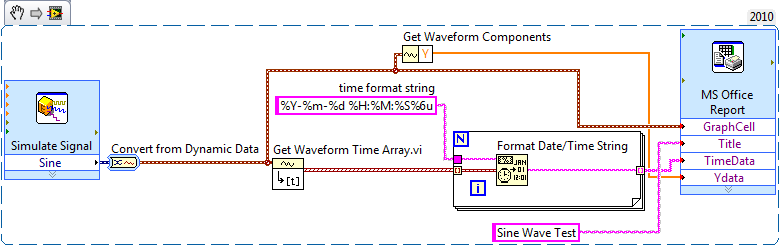
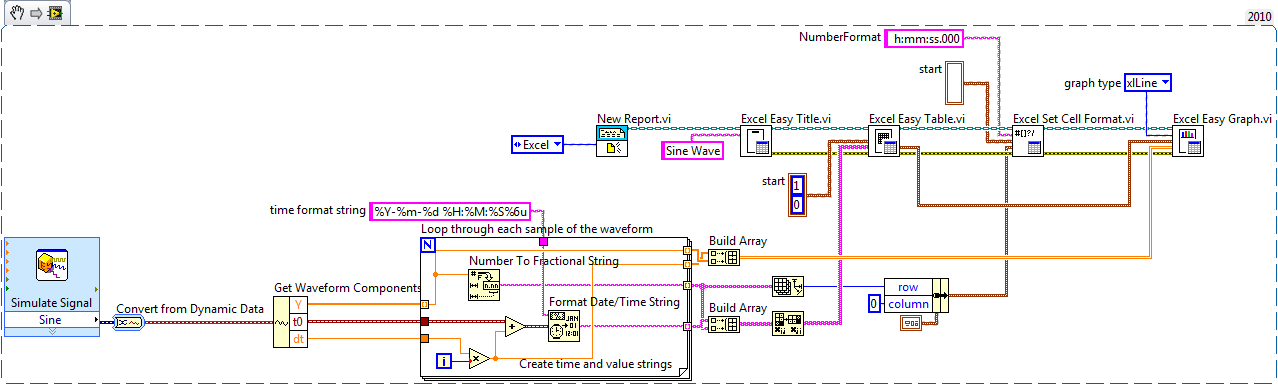
The NI LabVIEW Report Generation Toolkit for Microsoft Office gives you a lot of flexibility when it comes to sending data to Excel. One of the big advantages is that you can create a template workbook in Excel and save it as an .xltx or .xlt file and then use LabVIEW to populate your template with data when your VI runs. This code snippet shows how you can use the MS Office Report Express VI to populate such a template.
[+] 크게 보기
When you create the template, you can customize the formatting just like any other Excel workbook. You then name the cells where you will put data (for tables or arrays you just need to name the top-left cell).
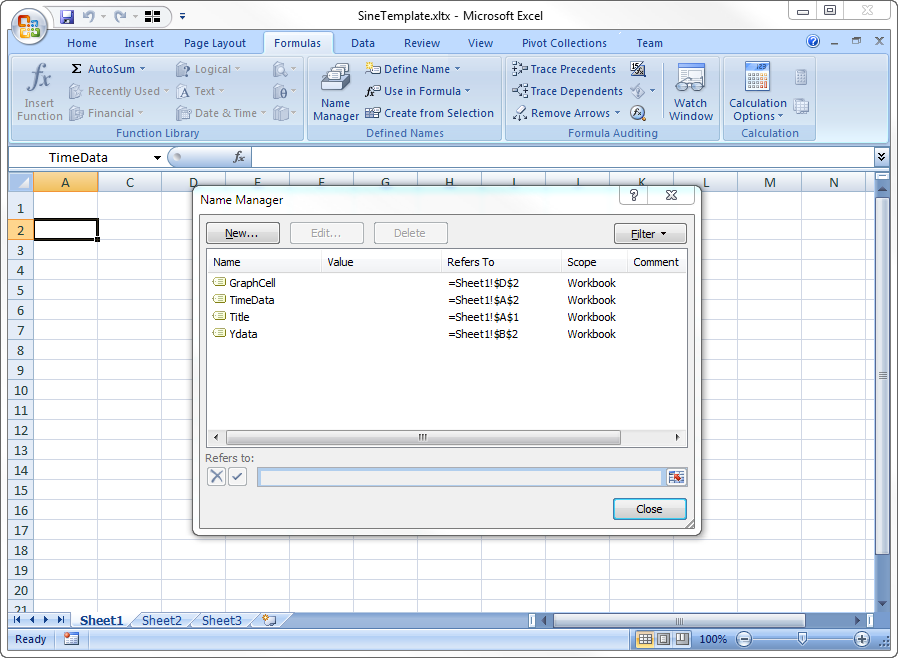
[+] 크게 보기
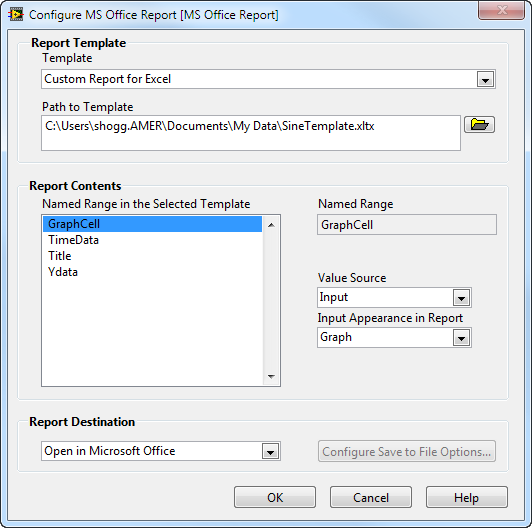
Once created, you point the Express VI to the template and tell LabVIEW how you would like the data to appear in the report (either as a table or graph) and whether you want to open, save, or print the Excel file.
[+] 크게 보기
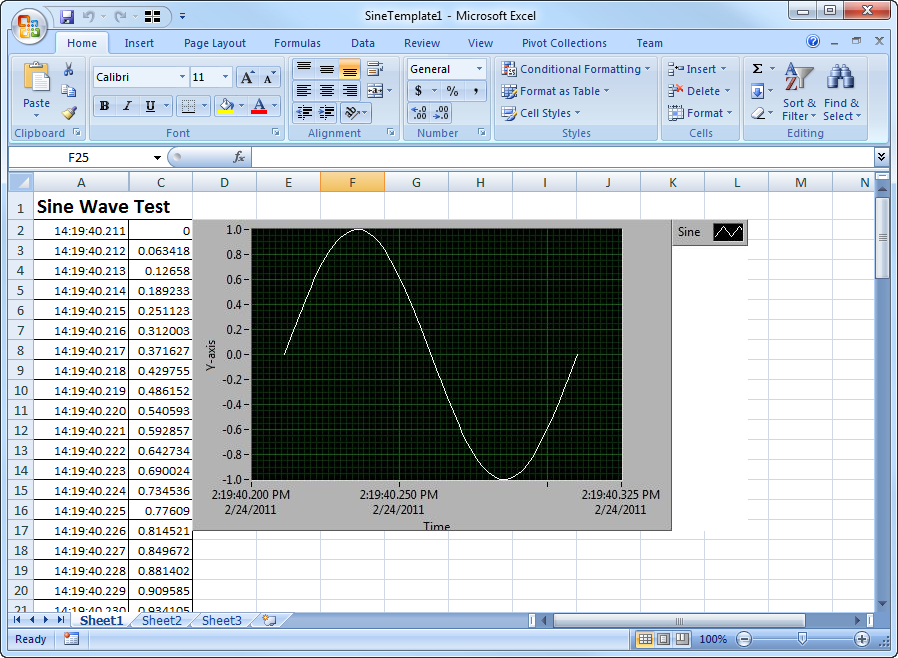
Running the code snippet above produces the output shown below. This is a very simple example of what you can do with this approach – as the name suggests, the Report Generation Toolkit is often used to automate complete reports instead of just sending simple data to Excel.
[+] 크게 보기
In addition to the Express VI, the Report Generation Toolkit gives you a full API you can use to automate Excel. The example code below creates output similar to the example above but does not require a template workbook. Also, instead of using an image of a LabVIEW graph, it uses the Excel charting tool to draw a graph.
[+] 크게 보기
Running the above example yields the following output:
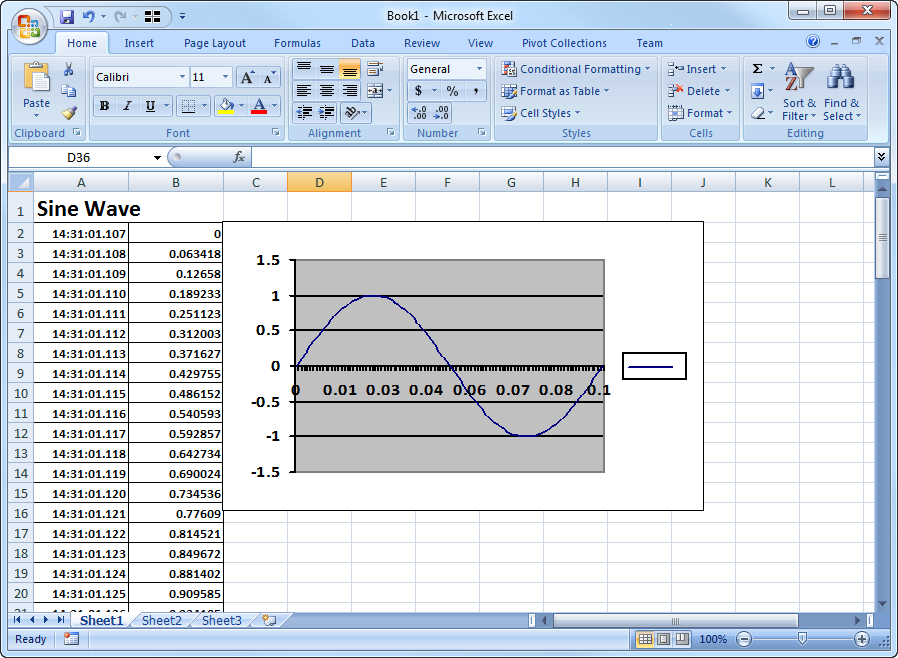
[+] 크게 보기
DIY ActiveX/.NET
The Report Generation Toolkit is built on top of the Excel ActiveX interface. You can use this API either through direct ActiveX calls or the Microsoft.Office.Interop.Excel .NET assembly to automatically create Excel files. The code snippet below produces essentially the same result as the Report Generation Toolkit example but instead uses a .NET interop assembly to communicate with Excel. As you can see, the code ends up a little more complex but anyone with a background in ActiveX/.NET programming should feel right at home.
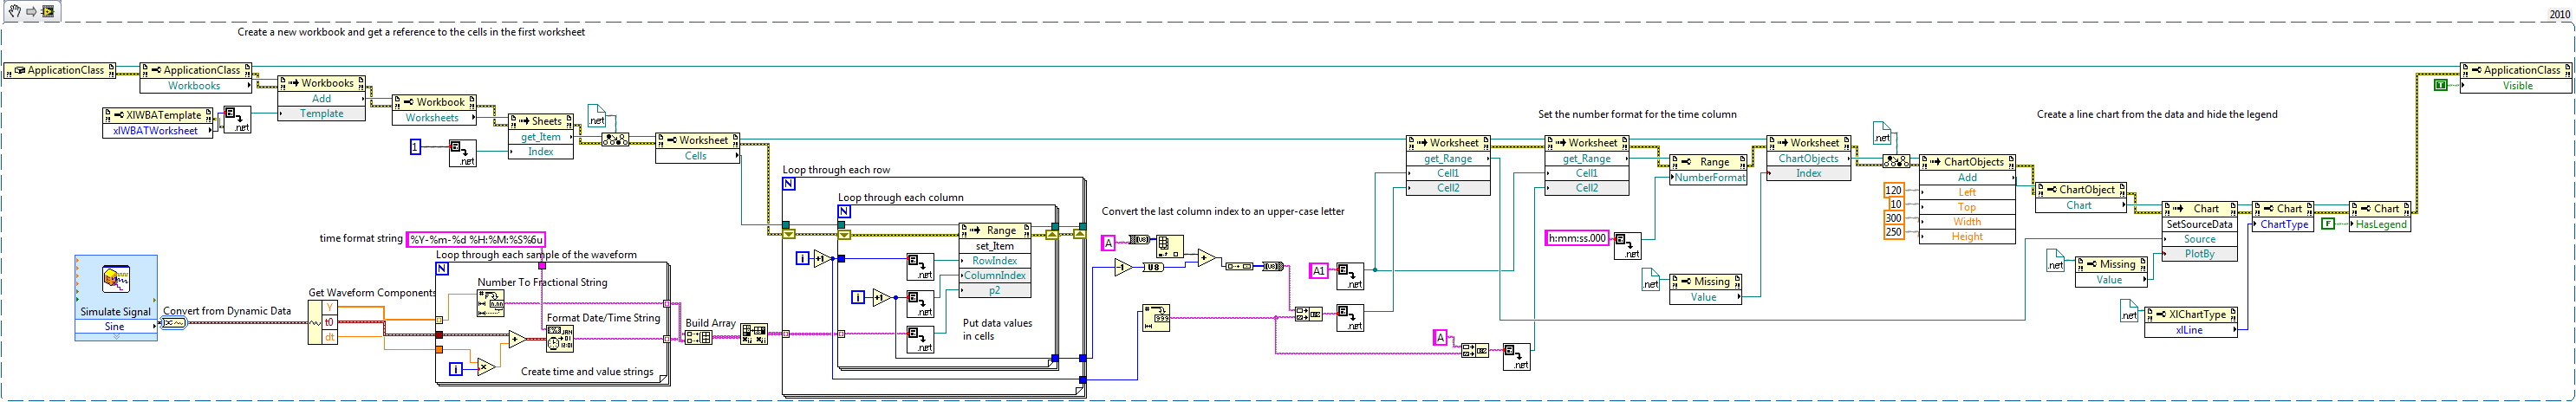
[+] 크게 보기
Here is the output of the above code snippet:
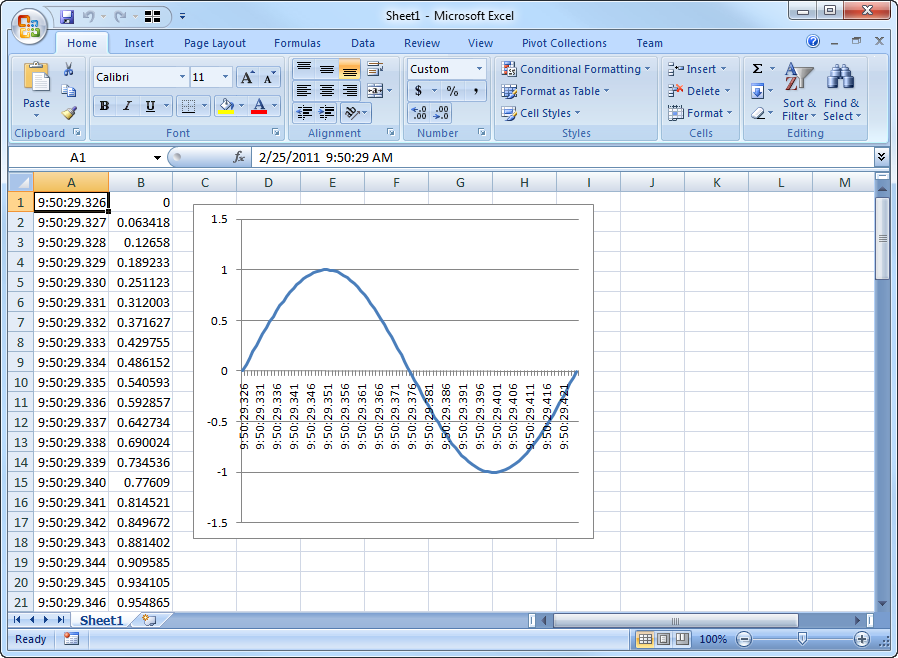
[+] 크게 보기
DIAdem as an Alternative
If you have more advanced data needs, whether it be larger datasets, an abundance of files, or particular reporting requirements, you should also consider DIAdem. DIAdem is a tool for quickly locating, analyzing, and reporting measurement data and is often better suited to the many demands engineers have of their data tools.
To learn more about gaining productivity by using DIAdem rather than Excel, read more.
:: 자료 출처 : http://zone.ni.com/devzone/cda/pub/p/id/1339?metc=mt4krj
 cin_FixLengthString.vi